نحوه معامله گزینه های باینری در IQ Option
IQ Option یک کارگزار آنلاین است که ابزارهای مالی مانند جفت فارکس، گزینه های باینری و دیجیتال، ارزهای دیجیتال، کالاها، ETF ها، شاخص ها و سهام را ارائه می دهد. همچنین یکی از شناختهشدهترین نامها برای معاملات گزینهها در جهان و تحت تعقیبترین پلتفرم است. اگر از یک معامله گر بپرسید که کجا معامله می کند، احتمالاً گوش خواهید داد: من گزینه های باینری را با گزینه IQ معامله می کنم.

What is an asset?
An asset is a financial instrument used for trading. All trades are based on the price dynamic of a chosen asset.
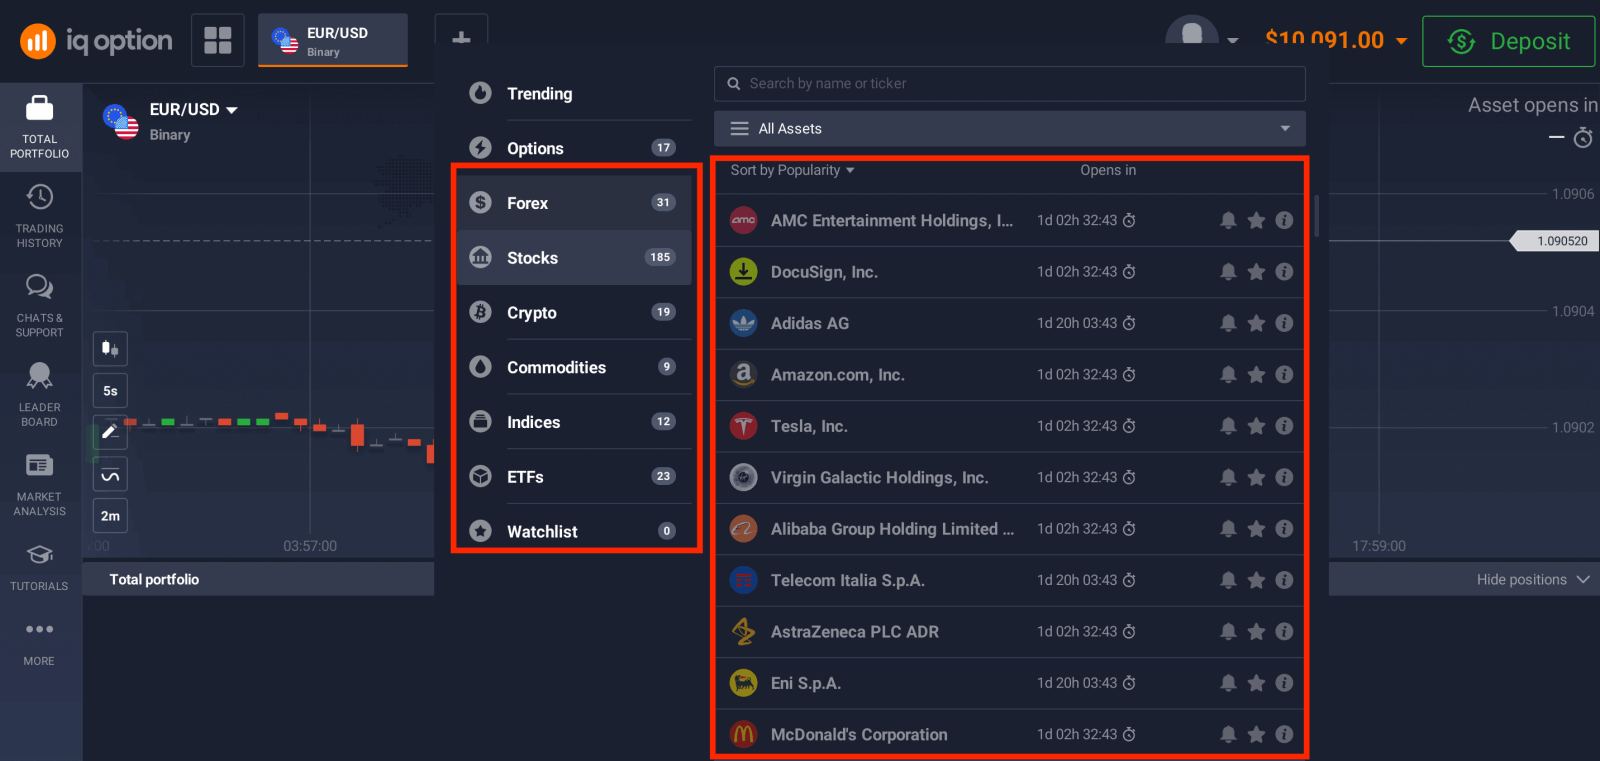
To choose an asset you want to trade on, follow these steps:
1. Click on the asset section in the top of the platform to see what assets are available.
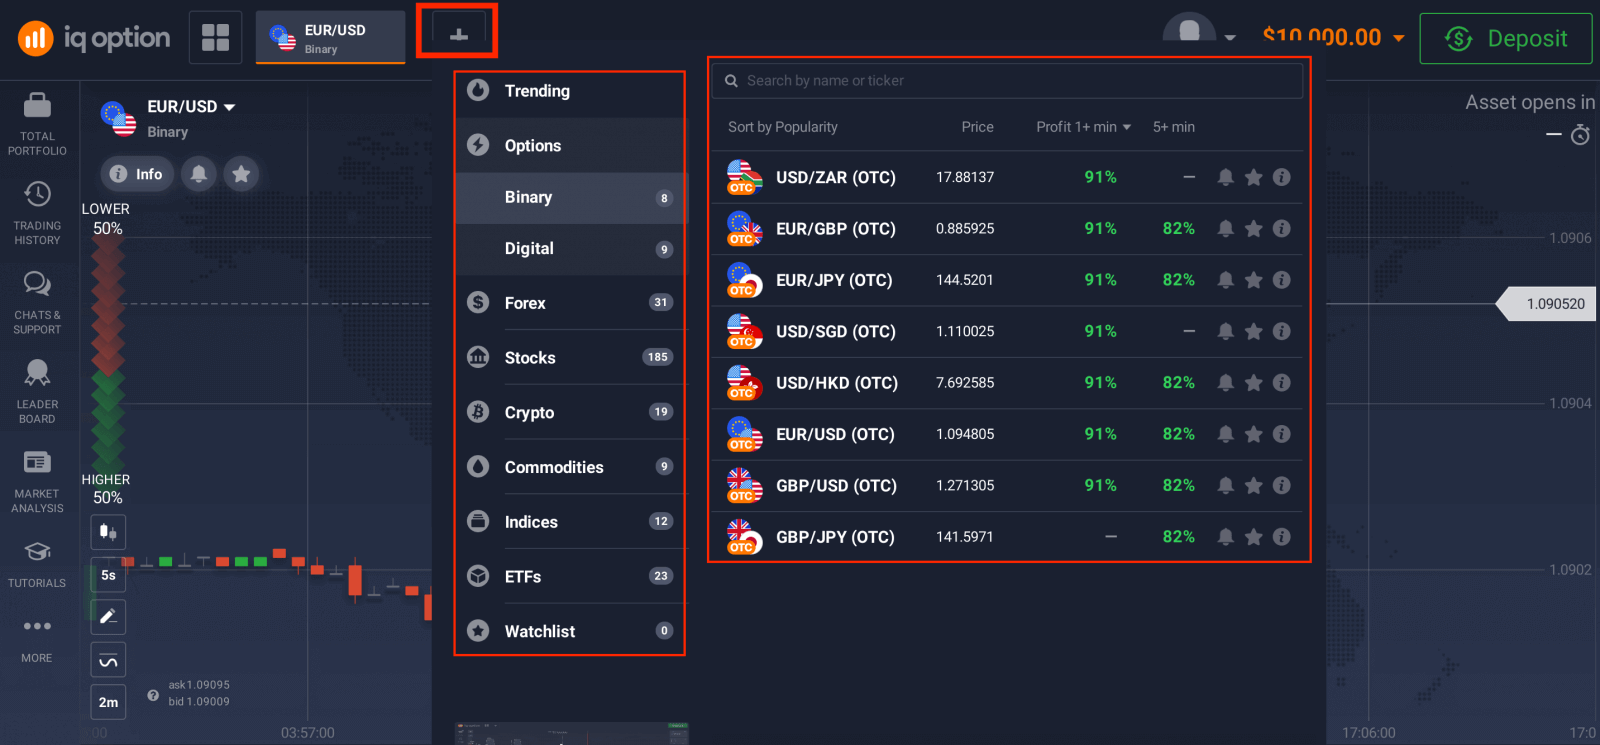
2. You can trade on multiple assets at once. Click on the “+” button right from the asset section. The asset you choose will add up.
How to Trade Binary Options?
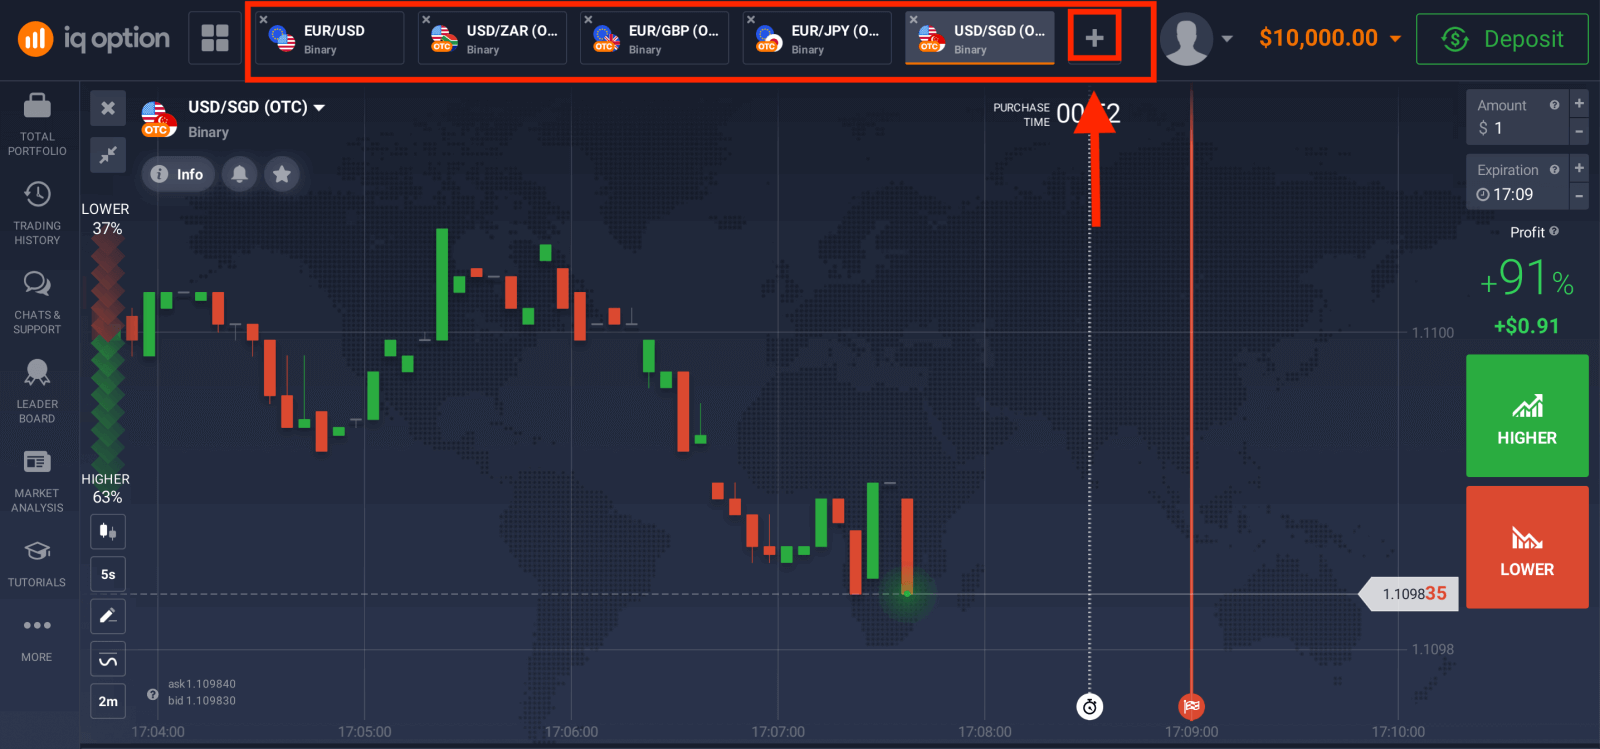
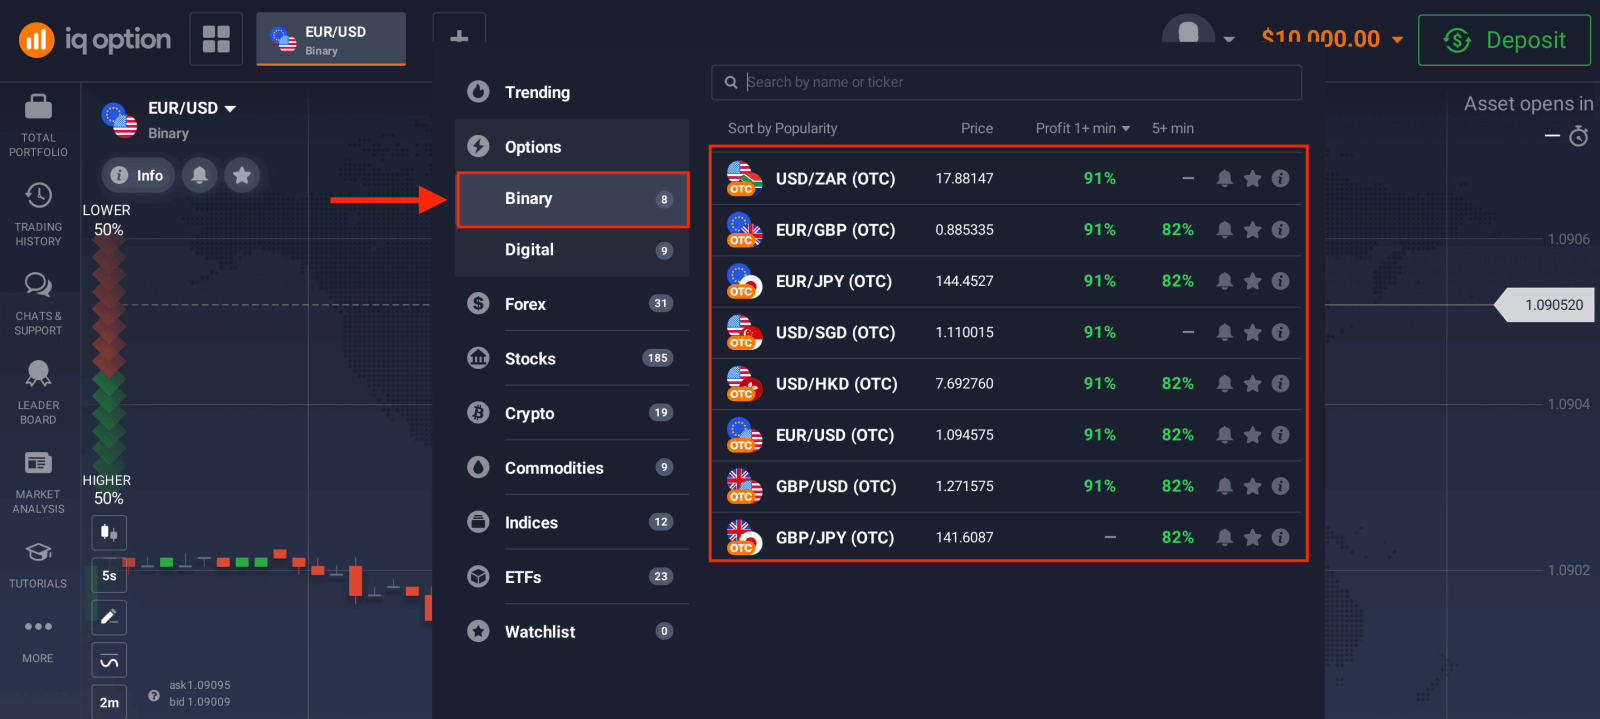
1. Select an asset. The percentage next to the asset determines its profitability. The higher the percentage – the higher your profit in case of success.
Example. If a $10 trade with a profitability of 80% closes with a positive outcome, $18 will be credited to your balance. $10 is your investment, and $8 is a profit.
Some asset’s profitability may vary depending on the expiration time of a trade and throughout the day depending on the market situation.
All trades close with the profitability that was indicated when they were opened.
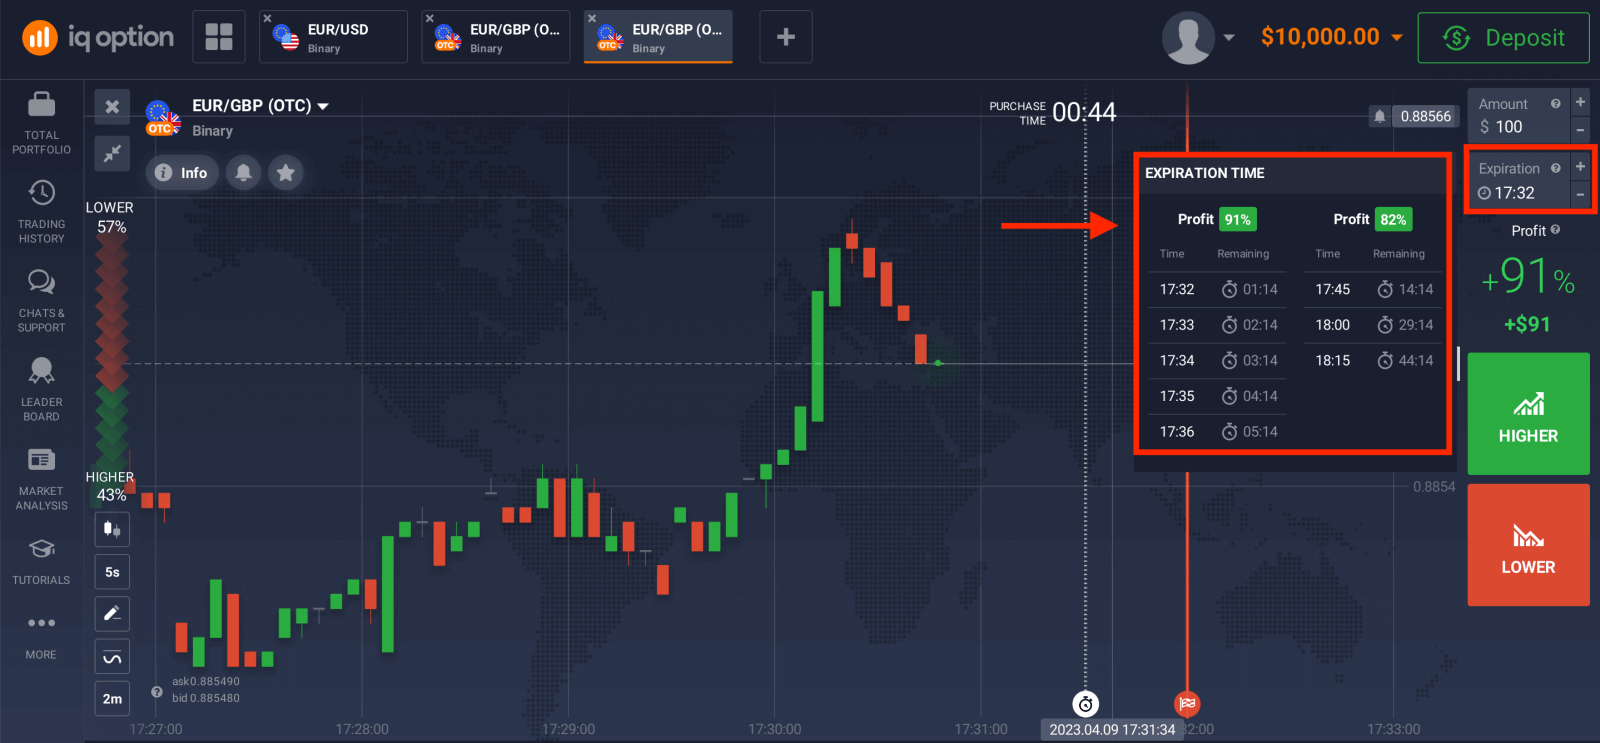
2. Choose an Expiration Time.
The expiration period is the time after which the trade will be considered completed (closed) and the result is automatically summed up.
When concluding a trade with binary options, you independently determine the time of execution of the transaction.
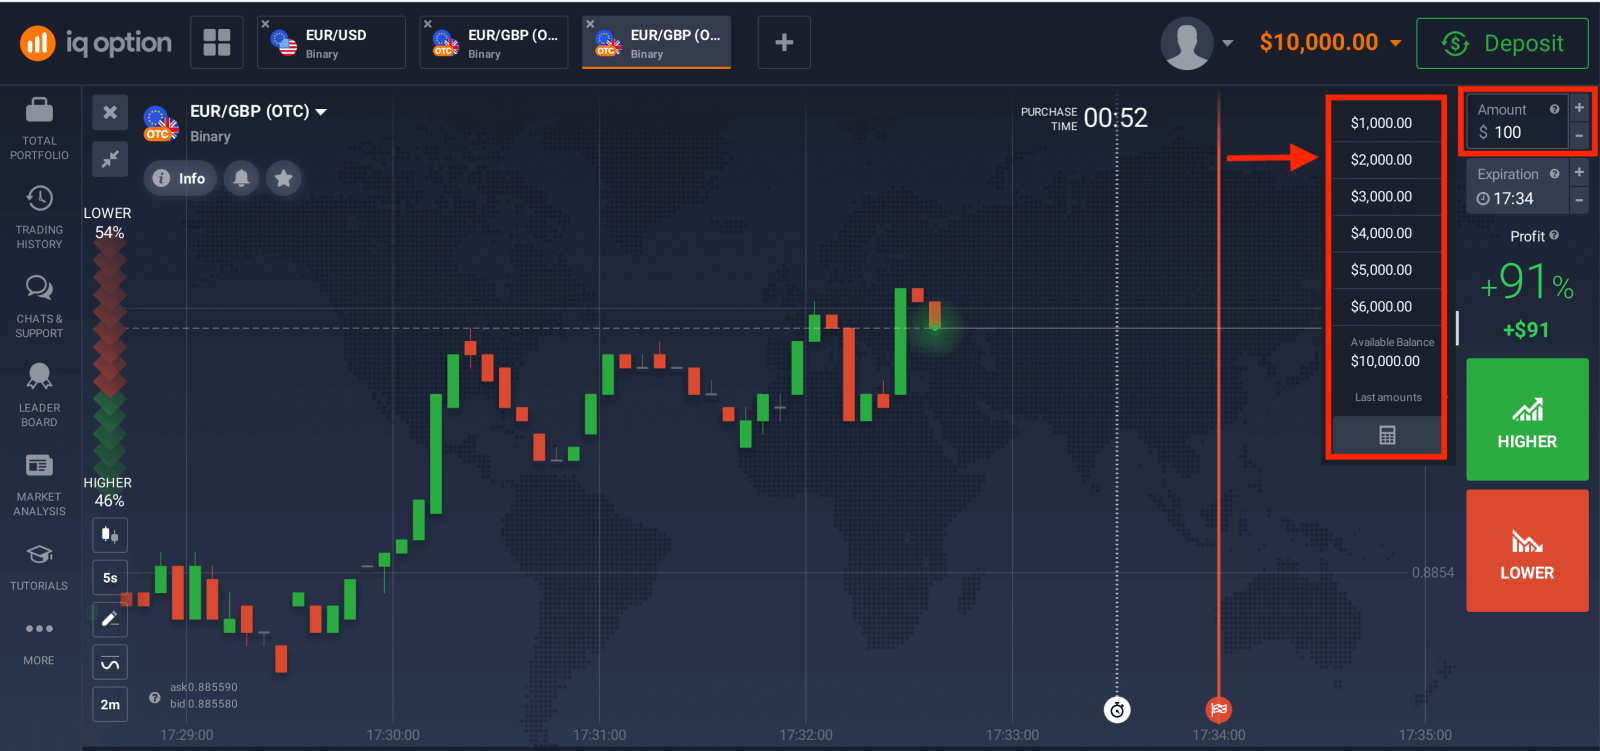
3. Set the amount you’re going to invest.
The minimum amount for a trade is $1, the maximum – $20,000, or an equivalent in your account currency. We recommend you start with small trades to test the market and get comfortable.
4. Analyze the price movement on the chart and make your forecast.
Choose Higher (Green) or Lower (Red) options depending on your forecast. If you expect the price to go up, press "Higher" and if you think the price to go down, press "Lower".
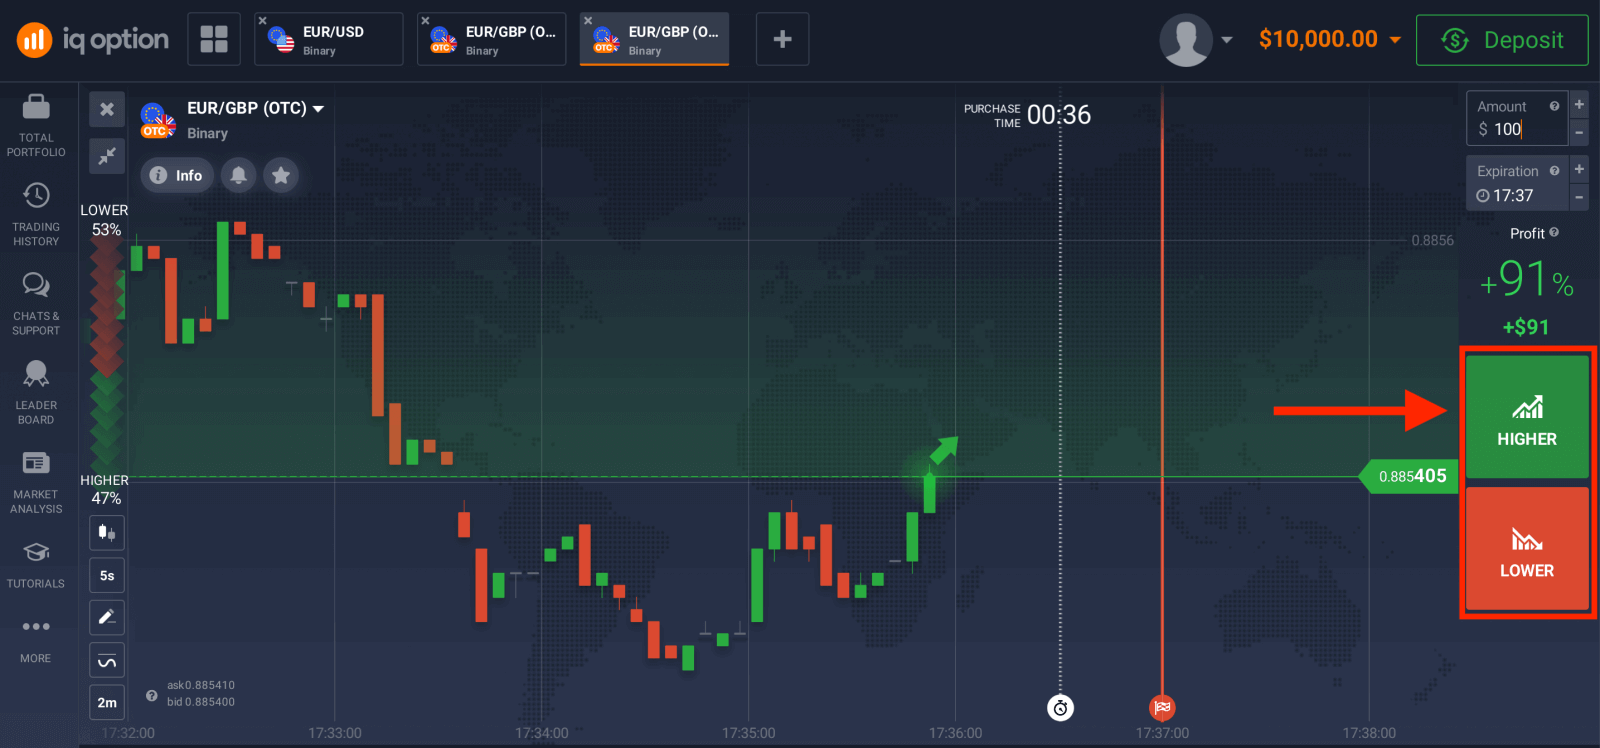
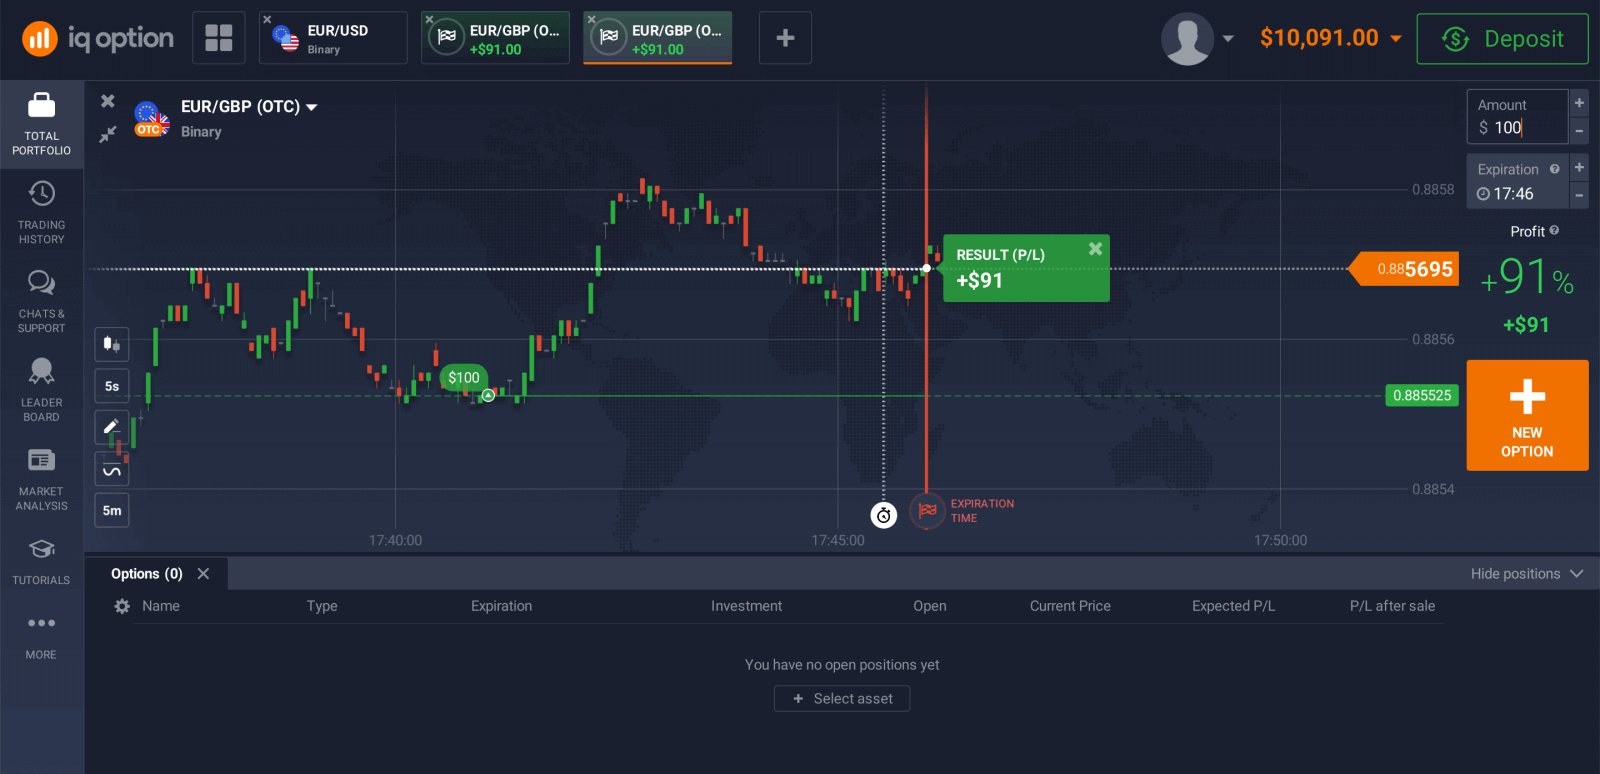
5. Wait for the trade to close to find out whether your forecast was correct. If it was, the amount of your investment plus the profit from the asset would be added to your balance. In case of a tie – when the opening price equals the closing price – only the initial investment would be returned to your balance. If your forecast was incorrect – the investment would not be returned.
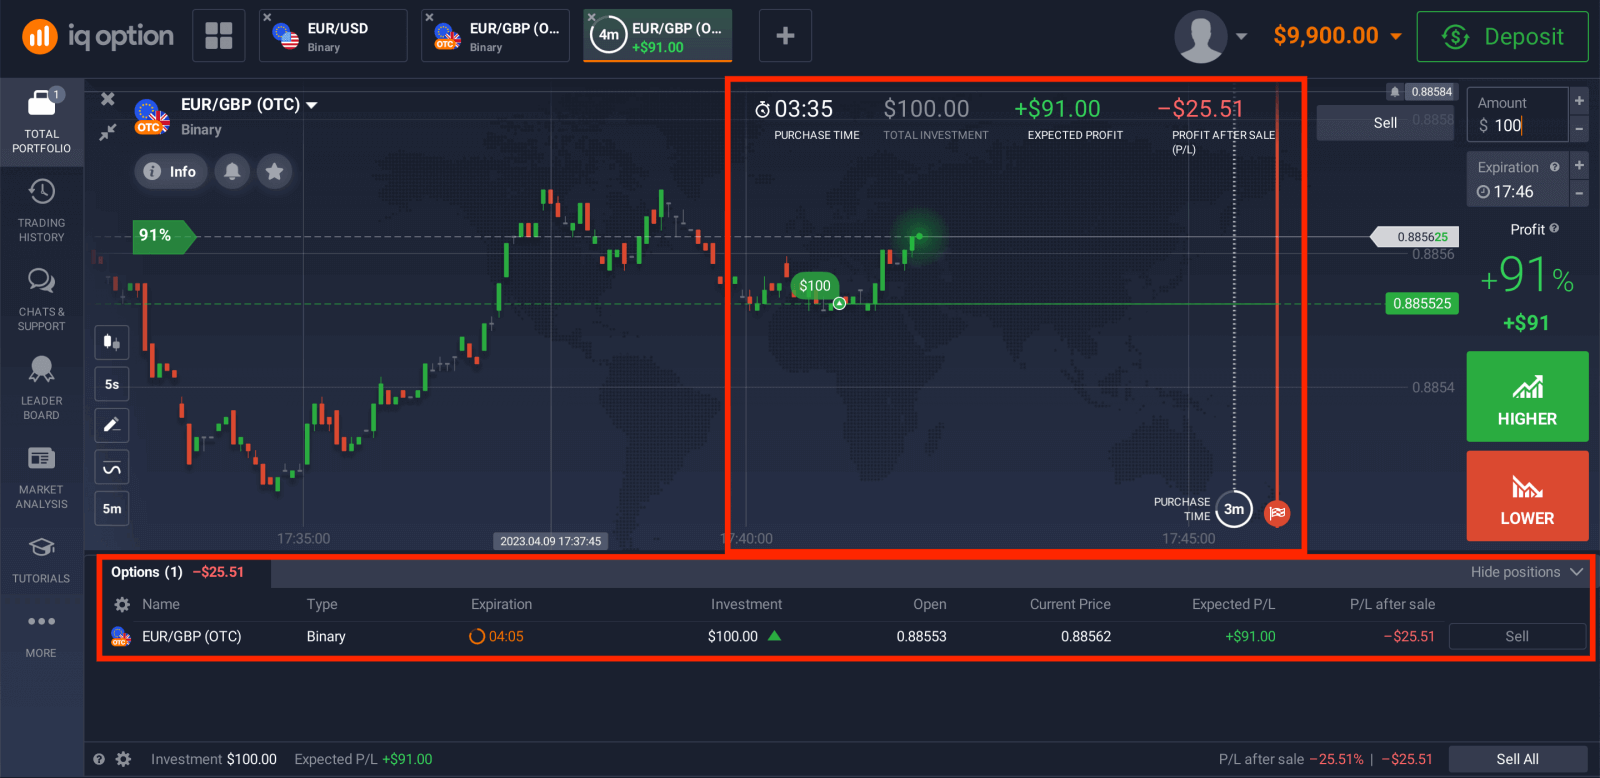
You can monitor the Progress of your Order under The Trades
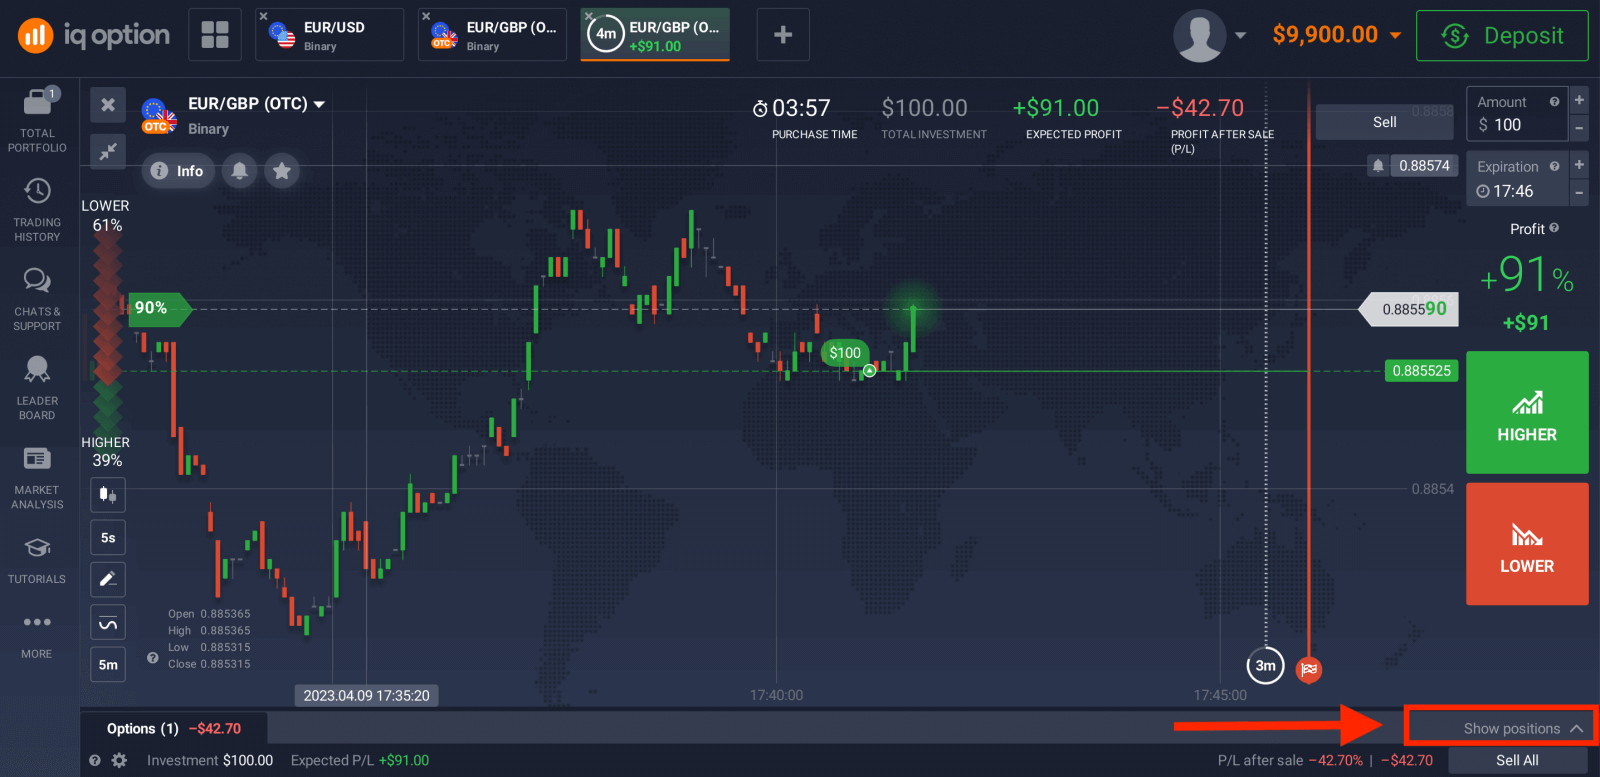
The chart shows two lines marking points in time. The purchase time is the white dotted line. After this time, you can’t buy an option for the selected expiration time. The expiration time is shown by the solid red line. When the transaction crosses this line, it closes automatically and you take either a profit or a loss for the result. You can choose any available expiration time. If you have not opened a deal yet, both white and red lines will be moving together to the right to mark the purchase deadline for the chosen expiration time.
The result from trading.
How to trade CFD instruments (Forex, Crypto, CFD)?
New CFD types that are available on our trading platform include CFDs on stocks, Forex, CFDs on commodities and cryptocurrencies, ETFs.
The trader’s goal is to predict the direction of the future price movement and capitalize on the difference between the current and future prices. CFDs react just like a regular market: if the market goes in your favor, then your position is closed In-The-Money. If the market goes against you, your deal is closed Out-Of-The-Money. In CFD trading, your profit depends on the difference between entry price and closing price.
In CFD trading, there is no expiration time, but you can use a multiplier and set stop/loss and trigger a market order if the price gets to a certain level.
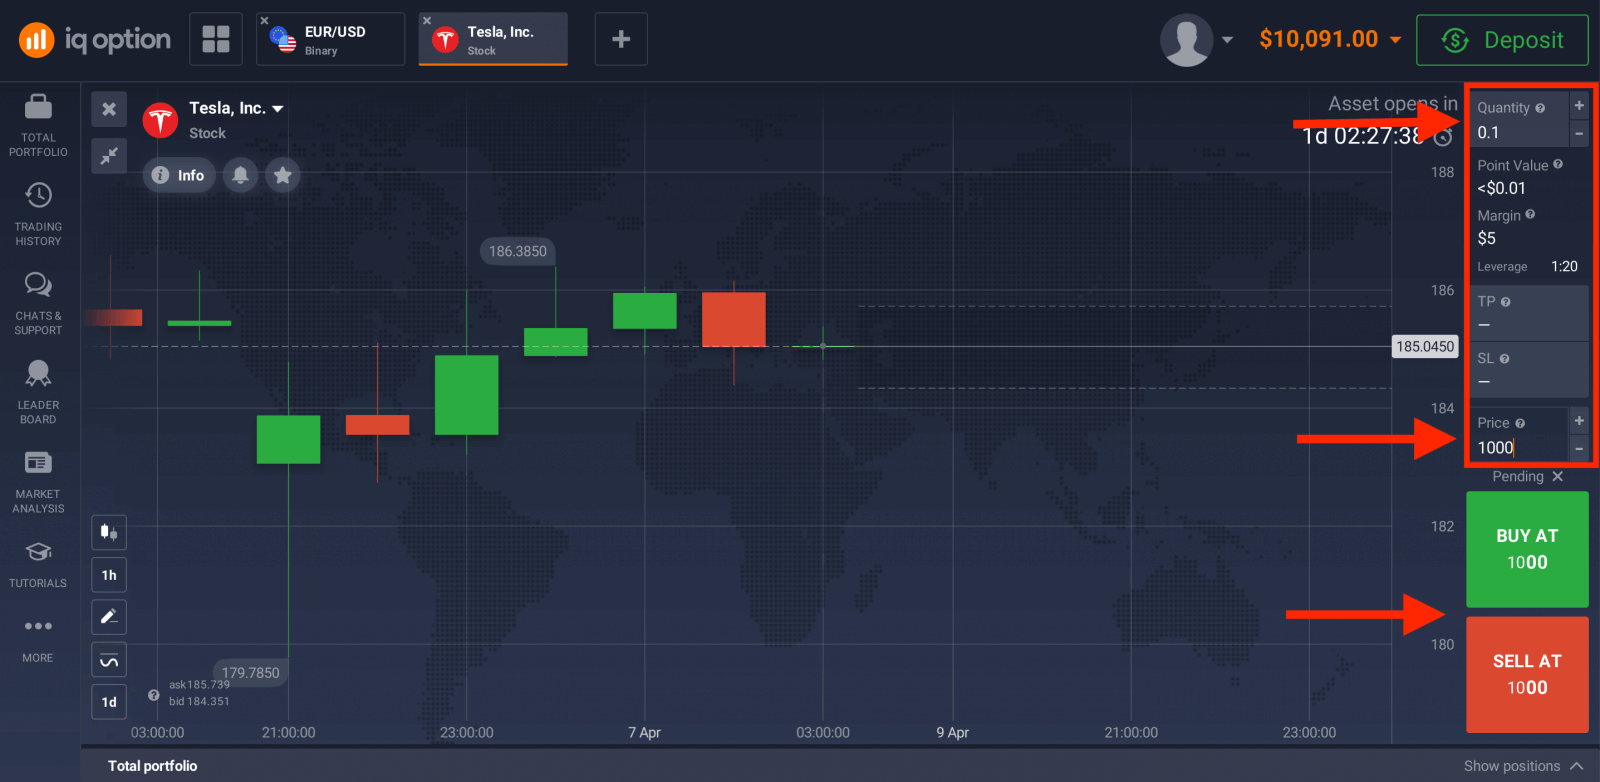
نحوه استفاده از نمودارها، شاخص ها، ابزارک ها، تحلیل بازار
ChartsIQ Option trading platform allows you to make all your presets right on the chart. You can specify order details in the box on the right-side panel, apply indicators, and play with settings without losing the sight of the price action.
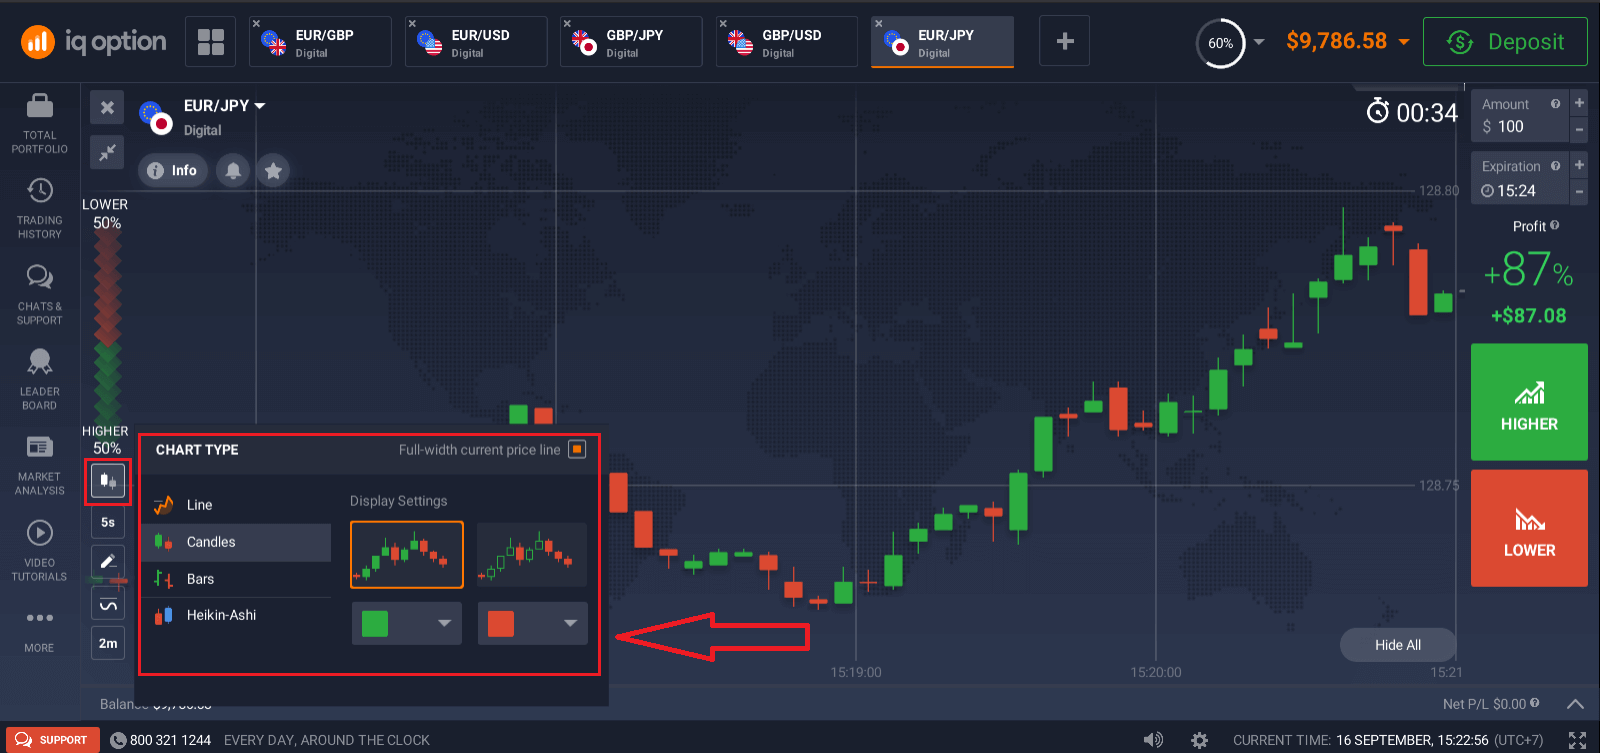
Want to trade multiple options at a time? You can run up to 9 charts and configure their types: line, candles, bars, or Heikin-ashi. For bar and candle charts, you can set up the time frames from 5 seconds up to 1 month from the bottom left corner of the screen.
Indicators
For in-depth chart analysis, use indicators and widgets. Those include momentum, trend, volatility, moving averages, volume, popular, and others. IQ Option has a fine collection of the most-used and essential indicators, from XX to XX, over XX indicators in total.
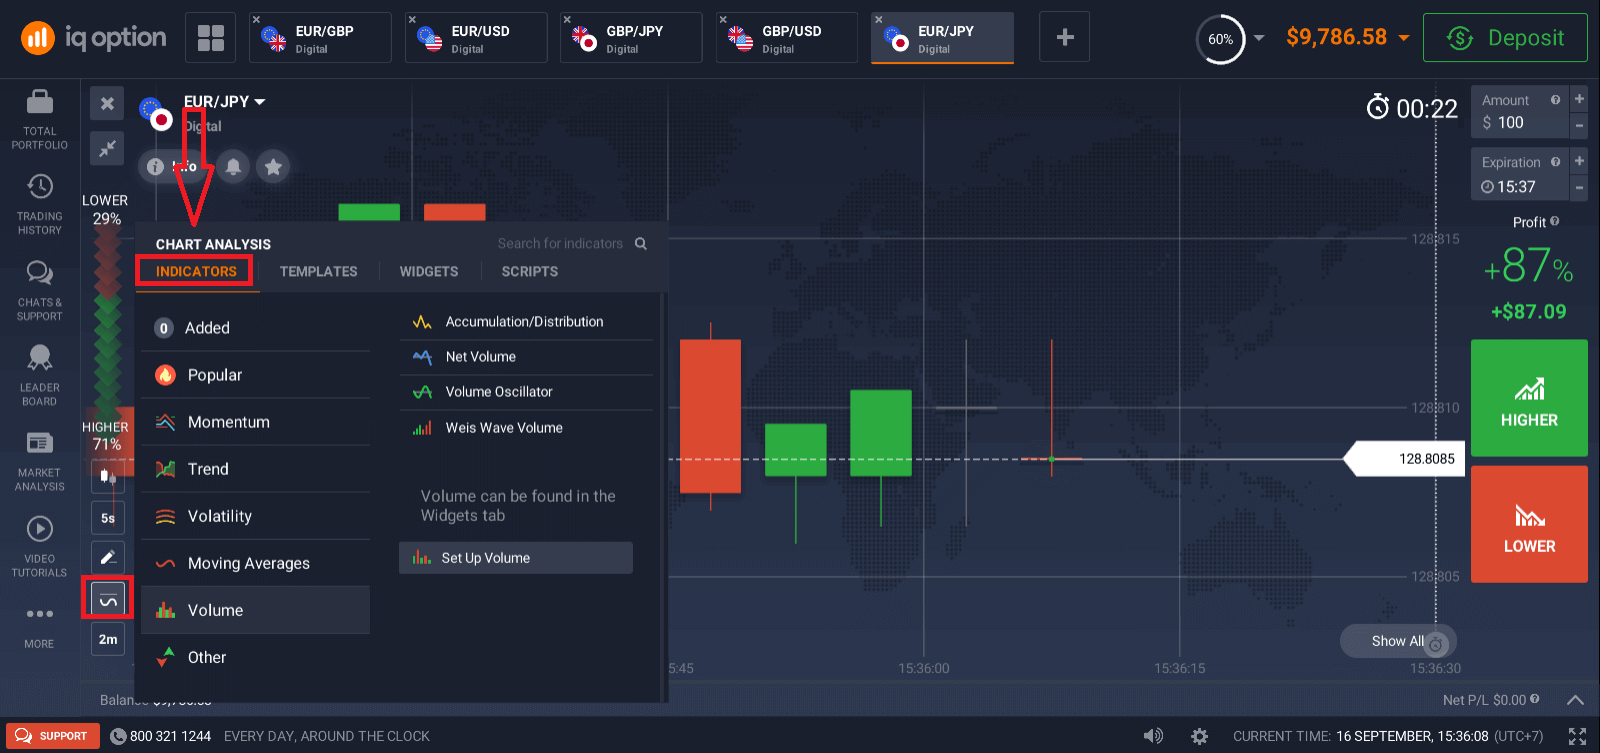
If you apply multiple indicators, feel free to create and save the templates to use them later
Widgets
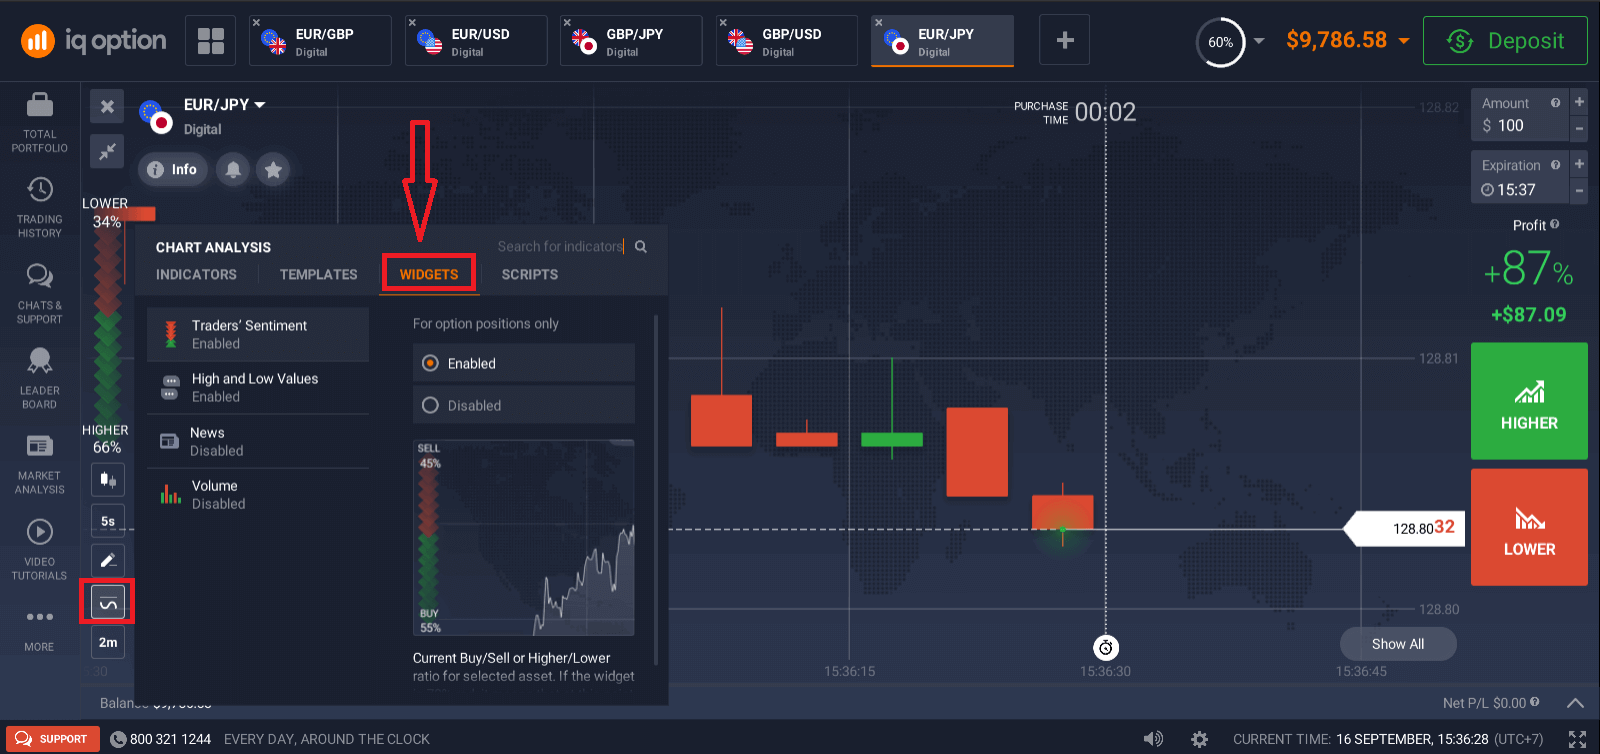
Widgets can help your decision-making big time. On the platform, you can use widgets like traders’ sentiment, high and low values, trades of other people, news, and volume. They will help you monitor changes in real-time.
Market analysis
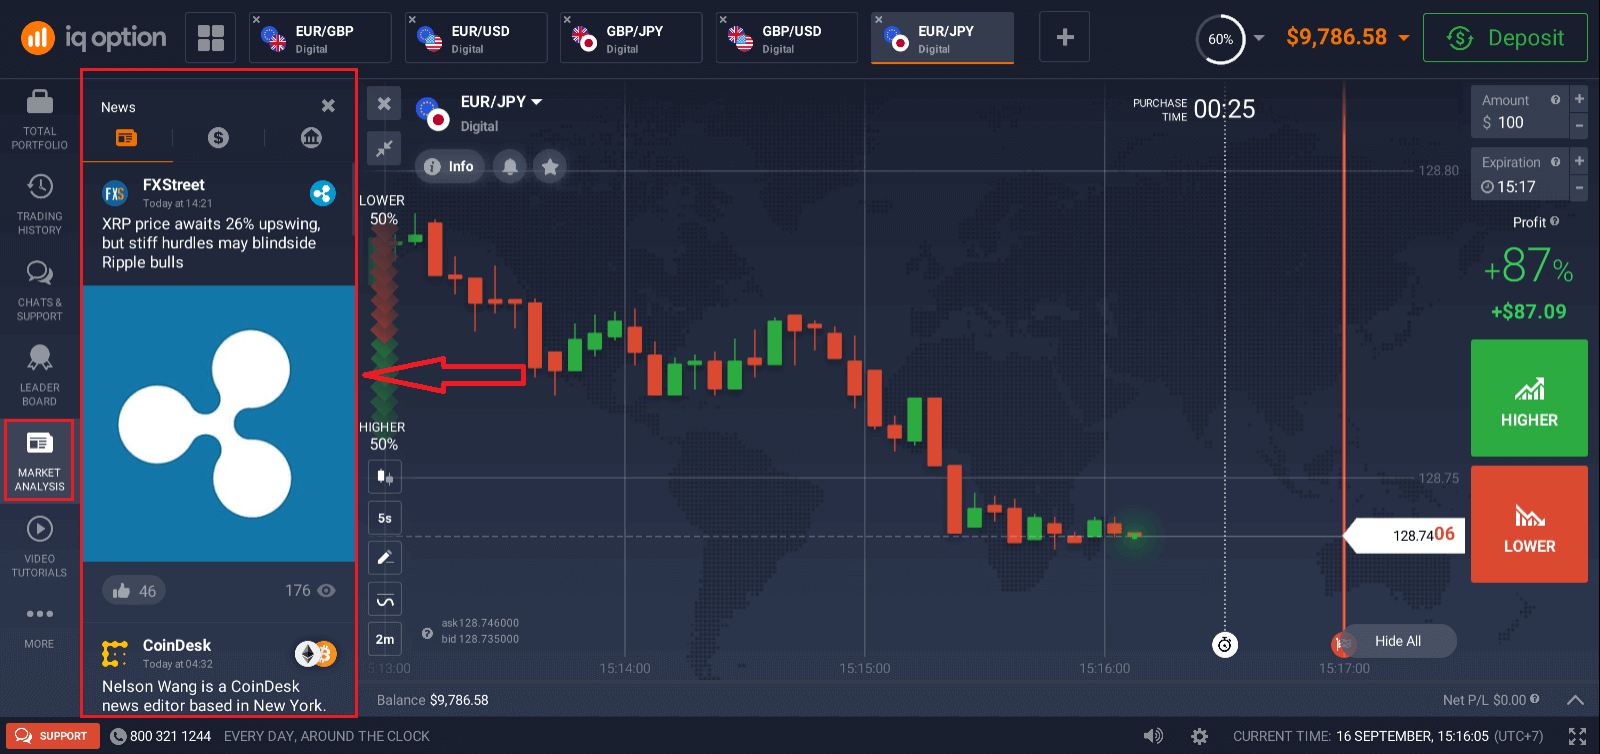
No matter if you trade options, Forex, stocks, metals, or cryptos, knowing what’s going on with the world economy is essential. At IQ Option, you can follow up on the news in the Market Analysis section without leaving the Traderoom. Smart news aggregator will tell you what assets are the most volatile right now, and themed calendars will give you an idea of when is the best moment to take action.
Frequently Asked Questions (FAQ)
What is the best time to trade for trading?
The best time to trade depends on your trading strategy and some other factors. We recommend that you pay attention to the market timetable, as the overlap of the American and European trading sessions makes prices more dynamic in currency pairs such as EUR/USD. You should also keep an eye on market news which could affect the movement of your chosen asset. Inexperienced traders who don’t follow the news and don’t understand why prices fluctuate are better off not trading when prices are very dynamic.What is the minimum investment amount to open a trade?
The minimum investment amount can be found on our trading platform/website, subject to current trading conditions.
What are the purchase time and expiration time?
The chart shows two lines indicating the time points. The time of purchase is the white dotted line. The expiration time is shown by the solid red line. When a trade crosses this line, it automatically closes and you make either a profit or a loss. You can choose any available expiration time. If you have not yet opened a trade, the white and red lines will move together to the right, indicating the buy deadline for the selected expiration time.
What is the profit after the sale and the expected profit?
"Total Investment" shows how much you invested in the trade.
"Expected Profit" shows the possible outcome of the trade if the chart remains at the current level by the time the trade expires.
Profit after Sale: If it is red, it shows how much of your investment you will lose after the trade expires. If it is green, it shows how much profit you will make after the sale.
The Expected Profit and Profit after Sale figures are dynamic. They vary depending on several factors, including the current market situation, the proximity of the expiration time, and the current price of the asset.
Many traders sell when they are not sure if the trade will make them a profit. The selling system gives you the opportunity to minimize your losses.
How does a multiplier work?
In CFD trading, you can use a multiplier that can help you control a position in excess of the amount of money invested in it. Thus, potential returns (as well as risks) will be increased. By investing $100, a trader can obtain returns comparable to an investment of $1,000. However, remember that the same applies to potential losses as they will also be increased several times.
How to use Auto Close settings?
Stop Loss is an order that the trader sets to limit losses for a particular open position. Take Profit works in much the same way, allowing the trader to lock in a profit when a certain price level is reached. You can set the parameters as a percentage, amount of money or asset price.
How to calculate profit in СFD trading?
If the trader opens a long position, the profit is calculated using the formula: (Closing price / Opening price - 1) x multiplier x investment. If the trader opens a short position, the profit is calculated using the formula (1 - Closing price / Opening price) x multiplier x investment.
For example, AUD / JPY (Short position): Closing price: 85.142 Opening price: 85.173 Multiplier: 2000 Investment: $2500 The profit is (1 - 85.142 / 85.173) X 2000 X $2500 = $1.819.82
What is OTC?
Over-the-counter (OTC) is a trading method that is available when the markets are closed. When trading OTC assets, you get quotes that are generated automatically on the broker’s server in a way that maintains equilibrium between buyers and sellers.Every Friday at 21:00 and every Monday at 00:00 am (GMT time) IQ Option is switching from market trading to OTC trading and from OTC trading to market trading.
What is slippage?
Slippage may occur when trading CFDs. This is the difference between the expected order price and the price at which the order is actually executed. It can work either positively or negatively. It most likely occurs during periods of increased volatility when market prices fluctuate very quickly. Such situation can arise both with Stop Loss orders and with Take Profit orders.
general risk warning

